- "SUPER - AGN feedback at Cosmic Noon: a multi-phase and multi-scale challenge". Mainieri et al. 2020, The Messenger, 182, 45
- "SUPER I. Toward an unbiased study of ionised outflows in z~2 active galactic nuclei: survey overview and sample characterisation". Circosta et al. 2018, A&A, 620, 82
- "SUPER II. Spatially resolved ionised gas kinematics and scaling relations in z~2 AGN host galaxies". Kakkad et al. 2020, A&A, 642, A147
- "SUPER III. Broad Line Region properties of AGN at z~2", Vietri et al. 2020, A&A, 644, A175
- "SUPER IV. CO(J=3-2) properties of active galactic nucleus hosts at cosmic noon revealed by ALMA', Circosta et al. 2021, A&A, 646, A96
- "SUPER V. ALMA continuum observations of z~2 AGN and the elusive evidence of outflows influencing star formation", Lamperti et al. 2021, A&A, 654, 90
- "SUPER VI. A giant molecular halo around a z~2 quasar", Cicone et al, 2021, A&A Letters, 654, 8
- "SUPER VII. Morphology and kinematics of Ha emission in AGN host galaxies at cosmic noon using SINFONI", Kakkad et al. 2023, MNRAS, 520, 5783
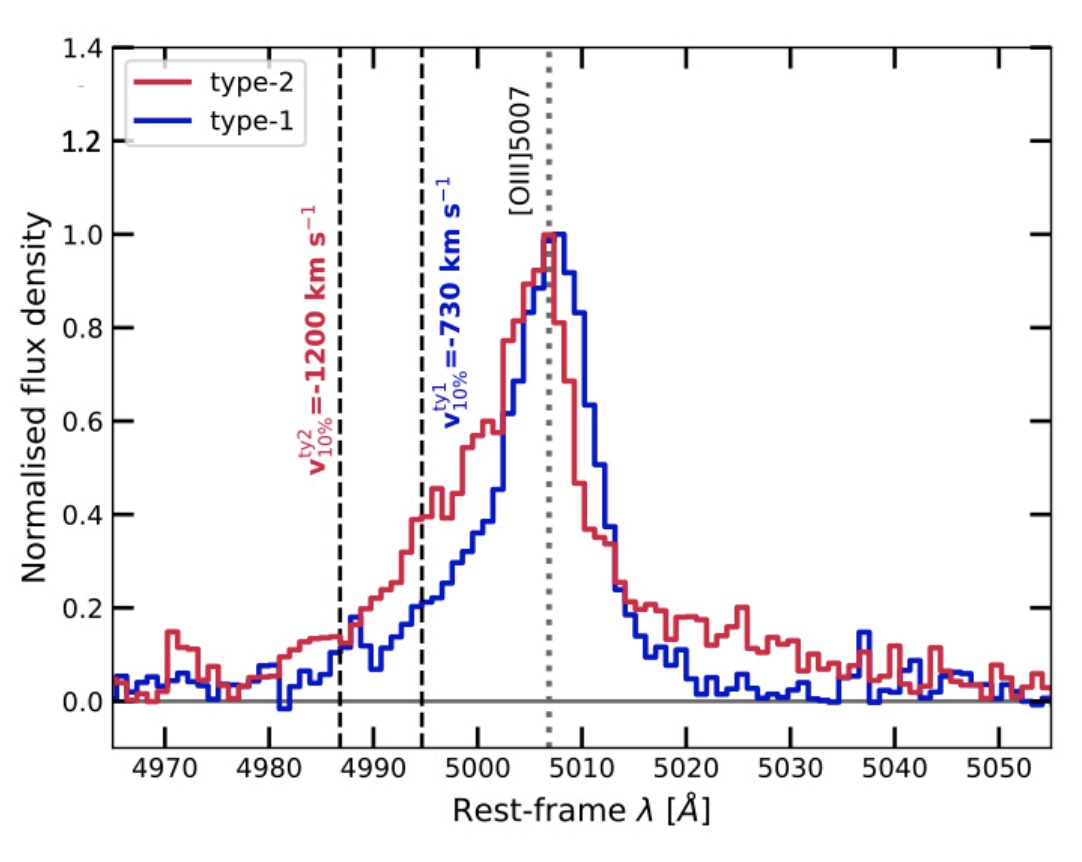
- "SUPER VIII. Fast and Furious at z~2: obscured type-2 active galactic nuclei host faster ionised winds than type-1 systems", Tozzi et al. 2024, A&A in press, arXiv.2407.04099
Circosta et al. (2018). "SUPER I. Toward an unbiased study of ionised outflows in z~2 active galactic nuclei: survey overview and sample characterisation"
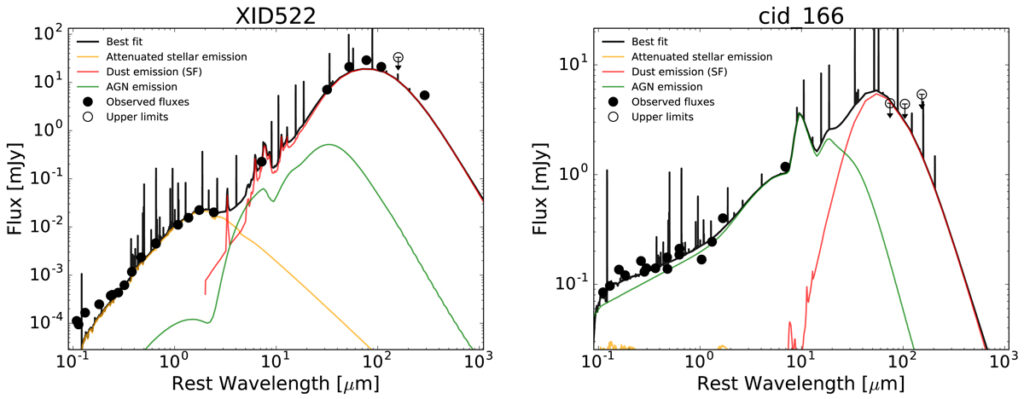
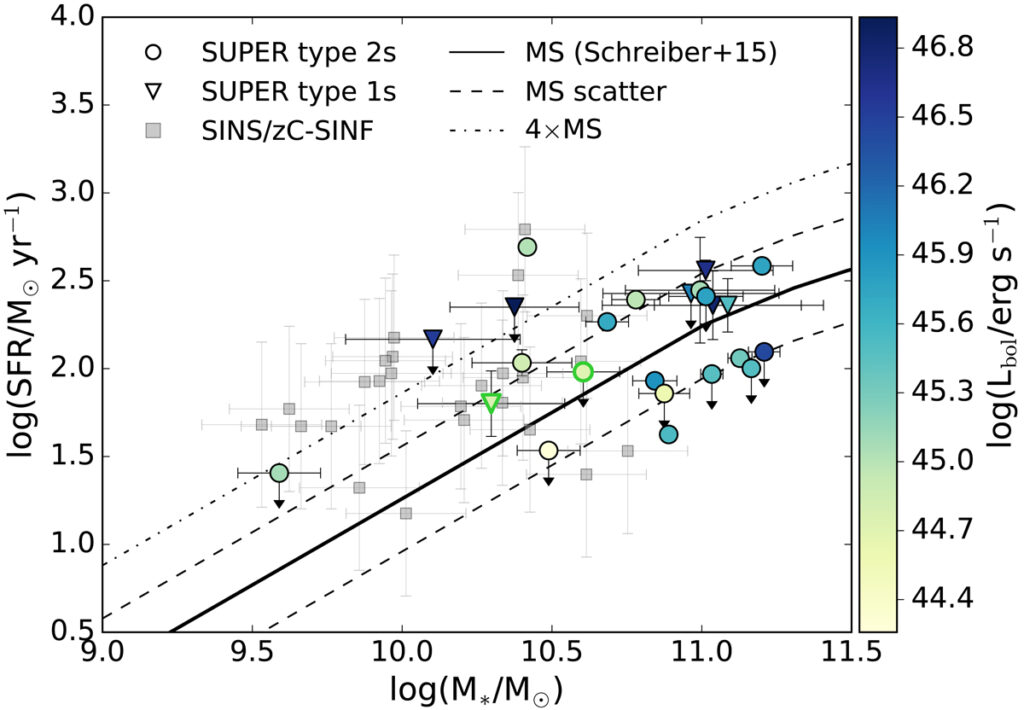
This paper introduce the survey and describe the targets selection criteria. It presents also a full characterisation of the multi-wavelength properties of each target. Spectral energy distribution fitting of UV-to-FIR photometry was used to derive stellar masses (4 × 10⁹ - 2 × 10¹¹ M☉), star formation rates (25 - 680 M☉ yr-1) and AGN bolometric luminosities (2 × 1044 - 8 × 1047 erg s-1). In addition, X-ray spectral analysis was used to measure the obscuring column densities (up to 2 × 1024 cm-2) and luminosities in the hard 2 - 10 keV band (2 × 1043 - 6 × 1045 erg s-1). Finally, we classify our AGN as jetted or non-jetted according to their radio and FIR emission.
Kakkad et al. (2020) "SUPER II. Spatially resolved ionised gas kinematics and scaling relations in z~2 AGN host galaxies"
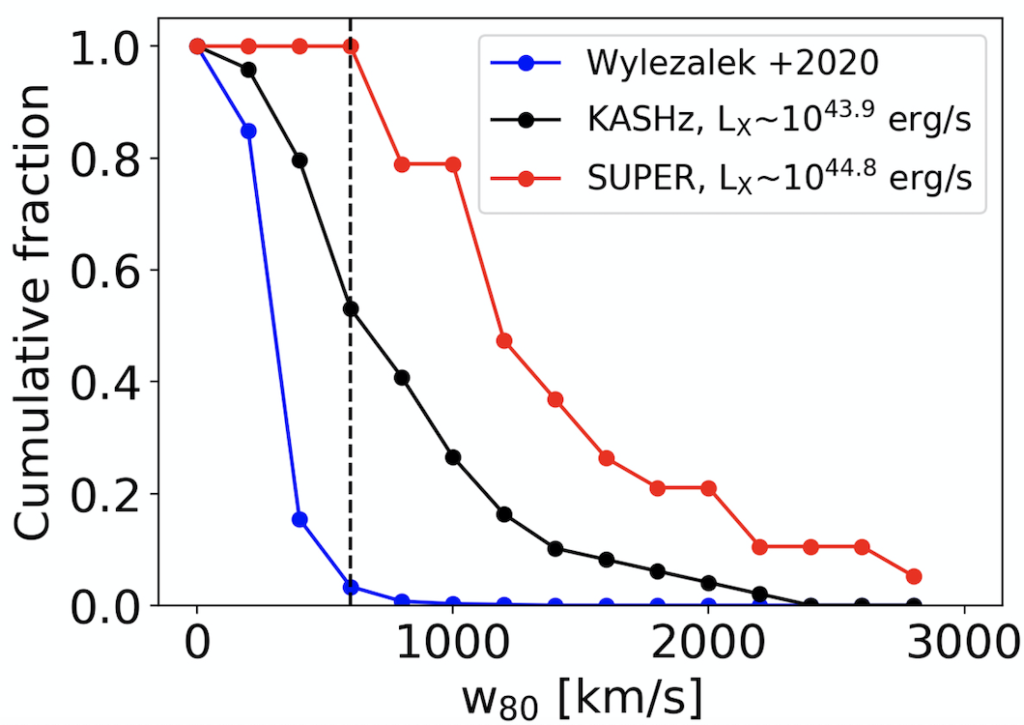
We present the first SINFONI results for a sample of 21 Type 1 AGN spanning a wide range in bolometric luminosity (log Lbol = 45.4–47.9 erg s−1). The main aims of this paper are to determine the extension of the ionised gas, characterise the occurrence of AGN-driven outflows, and link the properties of such outflows with those of the AGN. We detect outflows in all the Type 1 AGN sample based on the w80 value from the integrated spectrum, which is in the range ∼650–2700 km s−1. There is a clear positive correlation between w80 and the AGN bolometric luminosity (> 99% correlation probability), and the black hole mass (98% correlation probability). A comparison of the PSF and the [O III] radial profile shows that the [O III] emission is spatially resolved for ∼35% of the Type 1 sample and the outflows show an extension up to ∼6 kpc. The relation between maximum velocity and the bolometric luminosity is consistent with model predictions for shocks from an AGN-driven outflow. The escape fraction of the outflowing gas increases with the AGN luminosity, although for most galaxies, this fraction is less than 10%.
Vietri et al. (2020). Broad Line Region properties of AGN at z~2
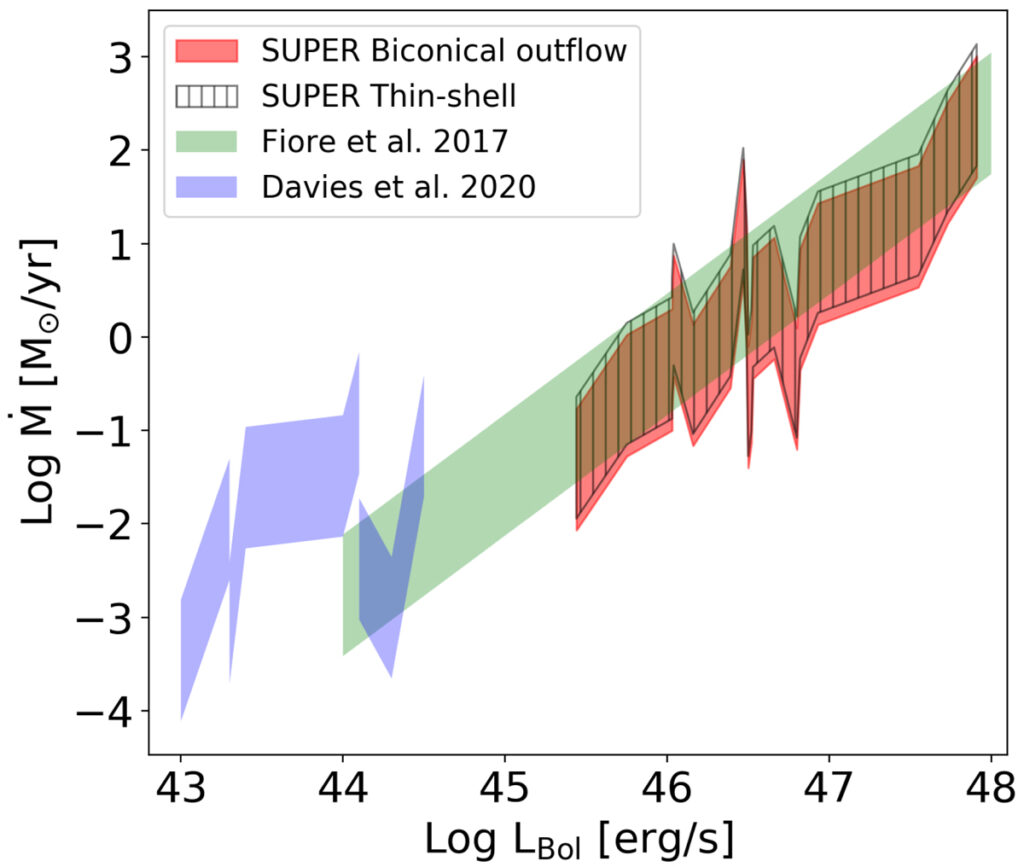
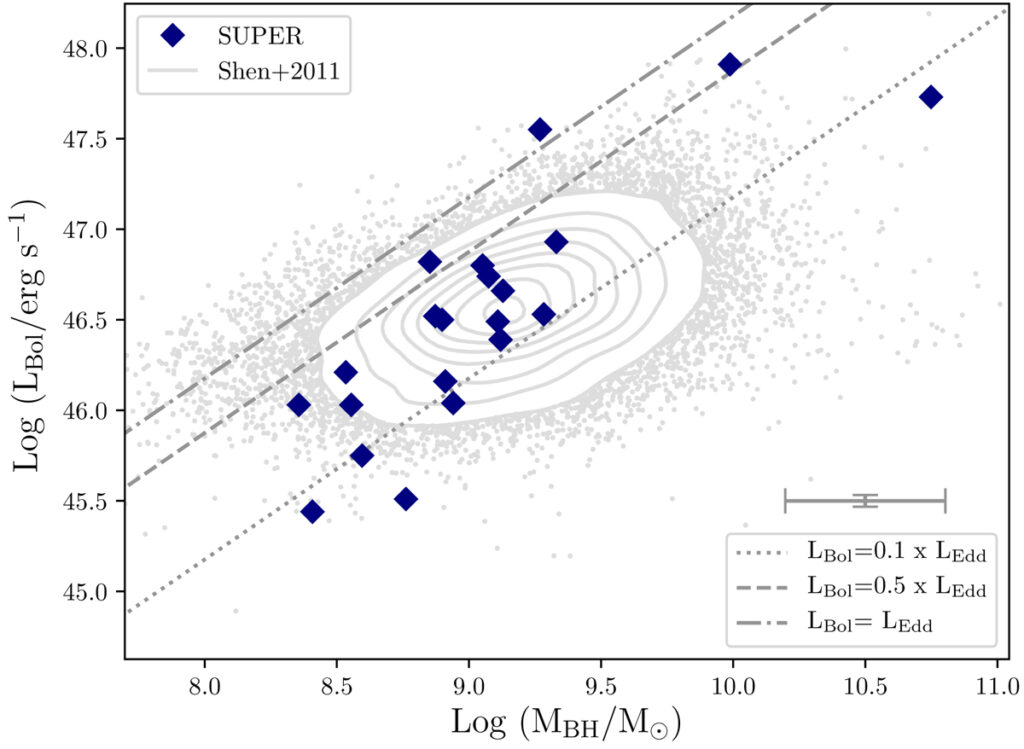
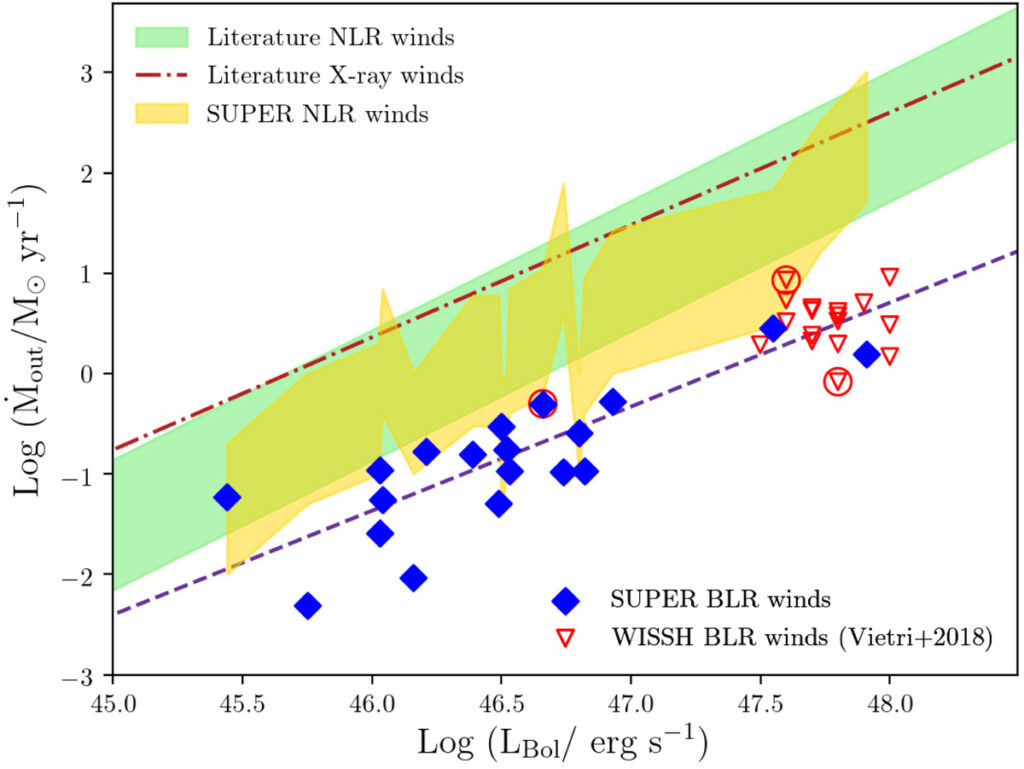
The main aims of this paper were: (a) to derive reliable estimates for the masses of the black holes and accretion rates for the Type-1 AGNs in this survey; and (b) to characterise the properties of the AGN-driven winds in the broad line region (BLR). Concerning the last point, we confirm that the CIV line width does not correlate with the Balmer lines and its peak is blueshifted with respect to the [OIII]-based systemic redshift. We interpreted this findings as the presence of outflows in the BLR with derived velocities up to ∼4700 km s−1. We derive mass outflows rates in the range 0.005–3 M⊙ yr−1 for the BLR winds. The mass outflow rate of the BLR winds shows a correlation with bolometric luminosity as steep as that observed for winds at sub-parsec scale distances and in the NLR. The kinetic power of the BLR winds inferred is Ėkin∼ 10[ − 7 : −4] × Lbol, and in 28% of the SUPER sample the kinetic power of the BLR and NLR winds are comparable.
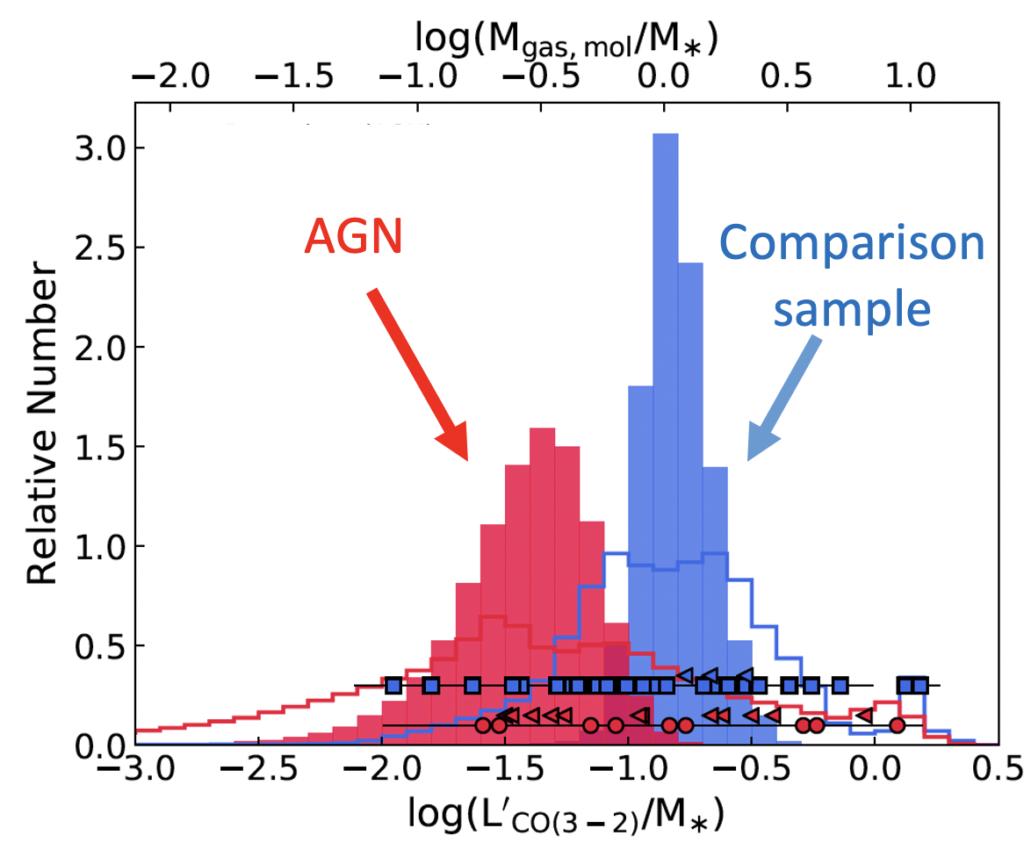
Circosta et al. (2021). CO(J=3-2) properties of active galactic nucleus hosts at cosmic noon revealed by ALMA
In this paper we present the first systematic study of the CO properties of AGN hosts at z~2 for a sample of 27 X-ray selected AGN spanning two orders of magnitude in AGN bolometric luminosity (Lbol= 10^44.7-10^46.9 erg/s) by using ALMA Band 3 observations of the CO(3-2) transition (~1" angular resolution). To search for evidence of AGN feedback on the CO properties of the host galaxies, we compared our AGN with a sample of inactive (i.e., non-AGN) galaxies from the PHIBSS survey with similar redshift, stellar masses, and SFRs. The two samples show statistically consistent trends in the LCO(3-2)-Lfir and LCO(3-2)-M* planes. However, there are indications that AGN feature lower CO(3-2) luminosities (0.4-0.7 dex) than inactive galaxies at the 2-3sigma level when we focus on the subset of parameters where the results are better constrained and on the distribution of the mean LCO(3-2)/M*. Therefore, even by conservatively assuming the same excitation factor r31, we would find lower molecular gas masses in AGN, and assuming higher r31 would exacerbate this difference. We interpret our result as a hint of the potential effect of AGN activity (e.g., radiation and outflows), which may be able to heat, excite, dissociate, and/or deplete the gas reservoir of the host galaxies.
Lamperti et al. 2021. ALMA continuum observations of z~2 AGN and the elusive evidence of outflows influencing star formation.
We used high resolution ALMA Band-7 continuum observations of wight AGN from SUPER to study the impact that AGN outflows may have on the dust properties, and possibly star-formation of the hosts. The majority of our sample show different morphologies for the FIR (mostly due to reprocessed stellar emission) and the ionised gas emission (Hα and [O iii], mostly due to AGN emission). Under the assumption that the FIR emission is a reliable tracer of obscured star formation, we find that the obscured star formation activity in these AGN host galaxies is not clearly affected by the ionised outflows. However, we cannot rule out that star formation suppression is happening on smaller spatial scales than the ones we probe with our observations (< 2 kpc) or on different timescales.
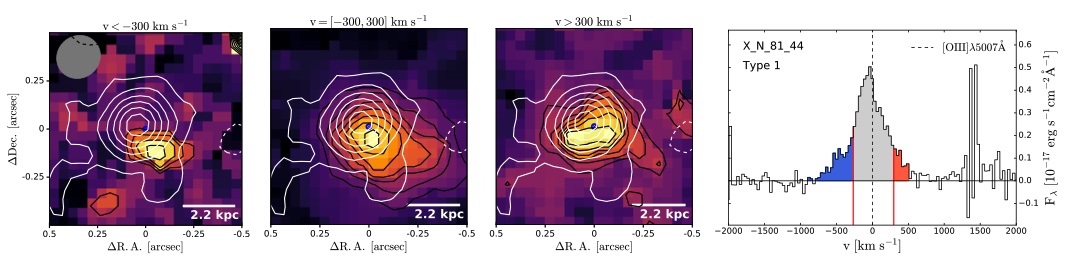
Maps of [Oiii] emission in three different velocity channels: blue-shifted emission (< -300 km s−1, first column), central channel ([-300, 300] km s−1, second column), red-shifted emission (> 300 km s−1, third column). The interval over which the spectrum has been integrated is indicated on the right plot. In black are the [O iii] emission contours starting from 2σ and increas- ing in intervals of 1σ. In white are the FIR emission contours, starting from 2σ and increasing in intervals of 2σ (or intervals of 4σ for X_N_81_44 and cid_346, to improve presentation). Negative -2σ contours are shown with dashed curves. The grey ellipse shows the size of the ALMA beam, while the white scale-bar shows the size of the PSF of the [O iii] image in kpc. The blue cross and circle show the position and uncertainty of the optical continuum. Fourth column: spectrum around the [O iii]λ5007 emission line. The coloured areas show the spectral regions over which the emission was integrated to create the three images on the left.
Cicone et al. 2021. A giant molecular halo around a z~2 quasar.
In this work we present the discovery of a gigantic molecular gas halo around cid346, a z=2.2 quasar studied as part of SUPER. New Atacama Compact Array (ACA) CO(3-2) observations detect a much higher flux (by a factor of 14±5) than measured on kpc-scales (r≲8 kpc) using previous snapshot Atacama Large Millimeter/submillimeter Array (ALMA) data. Such additional CO(3-2) emission traces a structure that extends out to r∼200 kpc in projected size. This is the most extended molecular circumgalactic medium (CGM) reservoir that has ever been mapped. Since cid346 hosts AGN-driven ionized outflows and since there is no evidence of merging companions or an overdensity, we suggest that outflows may have played a crucial rule in seeding metal-enriched, dense gas on halo scales. However, the origin of such an extended molecular CGM remains unclear.

ACA map obtained by integrating the CO(3-2) line emis- sion within −400 < v[km s−1] < 1000. For visualization pur- poses, the map has not been divided by the primary beam pro- file, hence the noise is uniform across the field. Negative con- tours are shown as dashed curves. Both negative and positive contours are plotted in steps of 1σ starting from ±1σ, with 1σ = 0.33 mJy beam−1. The phase center is indicated with a black cross and corresponds to the AGN position.
Kakkad et al. 2023. Morphology and kinematics of Ha emission in AGN host galaxies at Cosmic Noon.
We used the SUPER data to study the spatially resolved Ha properties of 21 Type-1 AGN host galaxies at z~2 with a medial spatial resolution of 0.3 arcsec (~2 kpc). We find extended Ha emission in 16 out the 21 host galaxies (76%). Based on the BPT diagnostics, optical line flux ratios and line widths (FWHM), we show that the H α emission in five galaxies is ionized by the AGN (30 per cent), in four galaxies by star formation (25 per cent) and for the rest (45 per cent), the ionization source is unconstrained. Two galaxies show extended H α FWHM >600 km s-1, which is interpreted as a part of an AGN-driven outflow. Morphological and kinematic maps of H α emission in targets with sufficient signal-to-noise ratio suggest the presence of rotationally supported discs in six galaxies and possible presence of companions in four galaxies. In two galaxies, we find an anticorrelation between the locations of extended H α emission and [O III]-based ionized outflows, indicating possible negative feedback at play. However, in the majority of galaxies, we do not find evidence of outflows impacting H α-based star formation.
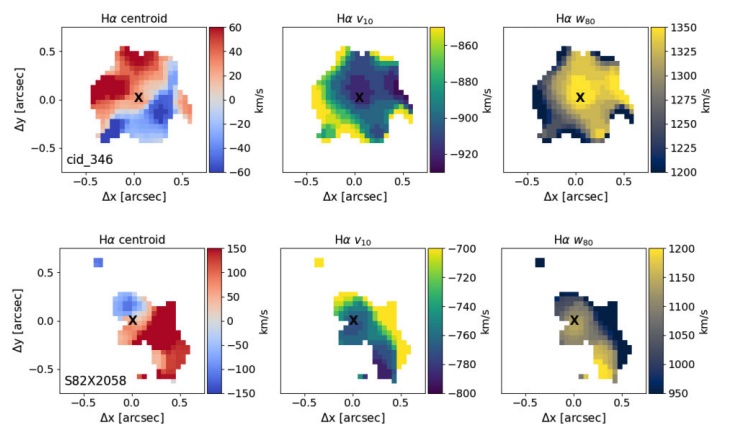
Ha NLR component velocity maps for two of the targets in Paper-VII. The left-hand panels show the H α centroid map, the middle panels the v10 map and the right-hand panels the w80 maps.